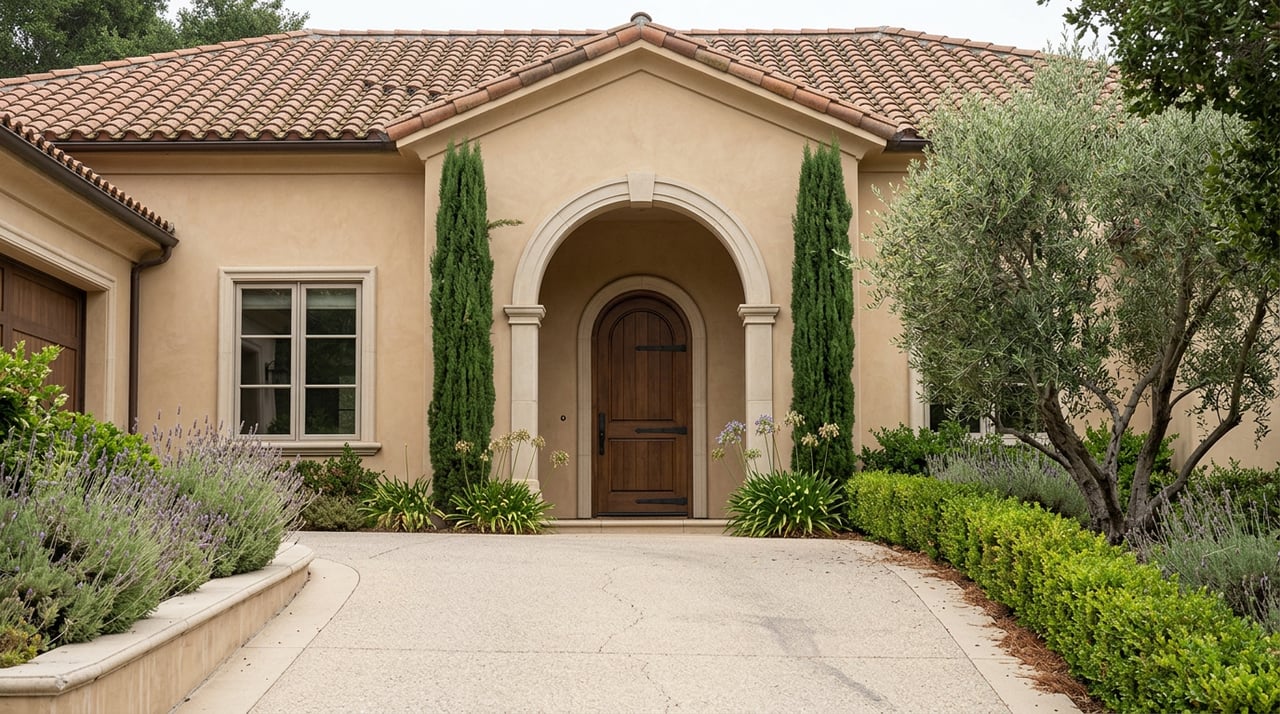
A buyer searching Fremont listings by zip code will pull up 94539 and see two things sitting side by side: Mission San Jose, with its hillside lots and $2 million-plus price tags, and Warm Springs, newer construction clustered near the BART station a few miles south. Same zip code. Same city. The natural assumption is that a home in either spot feeds into the same schools, so the price gap must come down to lot size or age of construction.
That assumption is wrong, and it costs people money in both directions. Warm Springs does not feed into Mission San Jose schools. It sits in the Irvington attendance area, with its own elementary assignment, its own middle school, and its own high school, entirely separate from the Mission San Jose side of the zip code. A buyer who picks a Warm Springs address expecting the Mission San Jose assignment finds out only after close, usually when it's too late to do anything but adjust plans. A buyer who assumes the opposite, that Warm Springs must be cheaper because it's a lesser version of the same school pull, is reasoning from a map that doesn't exist.
The Zip Code Doesn't Draw the School Line
This is the kind of detail that only shows up once you're deep enough into a specific transaction to ask the district directly, and it's exactly the sort of gap a citywide median price will never surface. Fremont Unified draws attendance boundaries by street, not by zip code, and 94539 happens to straddle two of them. Confirming which elementary, middle, and high school a specific address feeds into, before writing an offer, is a five-minute call to the district that changes how a buyer should be pricing the decision.
The reason this particular mismatch matters more than most boundary quirks is the size of the number attached to it. Adjusting for comparable home size, the effective premium for a Mission San Jose address over a similar Warm Springs home runs close to $650,000, based on 2026 sales data. Some of that gap is architecture and lot size. A meaningful piece of it is buyers paying to lock in a specific school assignment, and paying it based on an address that, within the same zip code, may or may not deliver what they think it delivers.
What the Premium Actually Buys
Fremont's citywide numbers already show the shape of this problem before you get anywhere near the schools question. The city's average sale price was $1.4 million in July 2026, down 14.2% year over year, according to Redfin's most recent update for the market. That single number is doing a lot of work to disguise six very different stories happening underneath it.
Zillow's home value index for Mission San Jose, which models the full stock of homes rather than just what closed, shows the neighborhood down 1.7% over the past year as of late July 2026. Redfin's transaction data for the same neighborhood tells the opposite story: over the three months ending May 2026, Mission San Jose's median sale price was up 17.6% year over year to $2.3 million, with homes selling in 11 days. Both numbers are accurate. They're measuring different things, one modeling total housing stock, the other counting what actually closed. Which one matters to you depends on whether you're valuing a home you already own or trying to win a bid on one for sale right now.
Here's roughly where each submarket sits as of mid-2026, based on the data available for each:
| Submarket | Approx. single-family median (2026) | What's driving it |
|---|---|---|
| Mission San Jose | ~$2.3M | Hillside lots, largest lot sizes in the city |
| Warm Springs | ~$2.05M–$2.18M | Newer construction, BART and South Fremont commute |
| Ardenwood | ~$1.6M–$1.7M | Dumbarton Bridge access, Peninsula spillover demand |
| Irvington | ~$1.45M median list | Central location, mix of ranch homes and newer builds |
| Niles | ~$1.4M | Oldest housing stock, historic district |
The gap between the top and bottom of that table is nearly $900,000, inside one city, inside what a portal will report as a single median.
Two Markets Inside One Neighborhood
Warm Springs is worth a second look on its own, because it isn't even one market internally. As of April 2026, single-family homes there were selling in 9 days at just over 105% of list price, a clear seller's advantage. Condos and townhomes in the same neighborhood were taking 27 days and closing closer to 95% of list, a balanced market by any standard measure. Two buyers looking at the same neighborhood name, filing the same search, are actually shopping in two different competitive environments depending on property type. That's a distinction a median price for "Warm Springs" collapses into one figure.
Niles Is Cheap, Not Static
Niles carries the lowest submarket median in Fremont, and it's tempting to read that as a neighborhood standing still. It isn't. The district earned Main Street Community status from the State of California in 1996, one of only five in the state at the time, and the Niles Main Street Association has kept pushing preservation and small business growth in the decades since.
That work is still visible on the ground. Ashley Wong Sweets, a bakery run by a former contestant on Halloween Baking Championship, opened its storefront on Niles Boulevard on July 25, 2026, with Fremont Mayor Raj Salwan presenting the owner a certificate of recognition at the ribbon cutting. A new small business opening on the district's main commercial strip is a better read on where Niles is headed than the median price alone. Affordable and inactive are not the same thing, and a buyer treating Niles purely as the budget option in Fremont is pricing today's number against a neighborhood that's still adding to itself.
Ardenwood's Bridge Premium
Ardenwood tells the opposite story from the other direction. It isn't the cheapest submarket in Fremont, but it's the one moving fastest, up roughly 13% year over year through early 2026 by some measures of the local data. The mechanism is straightforward: buyers priced out of Menlo Park and Palo Alto are crossing the Dumbarton Bridge and landing in Ardenwood instead, treating it as the affordable edge of a Peninsula commute rather than the pricey edge of a Fremont commute. That's a different buyer pool than the one shopping Mission San Jose or Niles, and it's part of why Ardenwood's growth rate has outpaced neighborhoods with objectively higher price points.
What This Means If You're Comparing Fremont Submarkets Right Now
If you're weighing Fremont neighborhoods against each other, three things are worth doing before you anchor on a number from a portal search.
First, confirm the school attendance boundary for the specific address, not the zip code. Fremont Unified draws these lines by street. A call to the district takes minutes and can change how you weigh a price against the alternative down the block.
Second, ask whether the figure in front of you is a transaction-based median or a value-index estimate. They can move in opposite directions in the same neighborhood in the same month, and only one of them reflects what buyers are actually paying right now.
Third, separate property type within a neighborhood before comparing it to another neighborhood. Warm Springs condos and Warm Springs single-family homes are behaving like two different markets. Treating the neighborhood median as one number will mislead you either way you're using it.
A Few Direct Questions
Does every address in the 94539 zip code feed into Mission San Jose schools? No. Warm Springs shares the 94539 zip code with Mission San Jose but sits in a separate Fremont Unified attendance area. Confirm the specific boundary for any address with the district before writing an offer.
Is Niles still the least expensive place to buy in Fremont? Based on 2026 submarket data, yes, Niles carries the lowest median among Fremont's historic districts. It's also actively adding small businesses, including a new bakery on Niles Boulevard that opened in July 2026, so the low median shouldn't be read as a sign the district is inactive.
Why is Ardenwood's price growth outpacing higher-priced Fremont neighborhoods? Ardenwood is pulling buyers who are being priced out of Peninsula cities like Menlo Park and Palo Alto and are using the Dumbarton Bridge as their commute route instead. That demand pool is different from the buyers shopping Mission San Jose or Niles, and it's pushed Ardenwood's growth rate above neighborhoods with higher absolute prices.
If you're trying to figure out which Fremont submarket actually fits your budget and your must-haves, a citywide median won't get you there, and neither will a single portal search filtered by zip code. Moni Shah has spent two decades working these blocks street by street. Let's talk. Get your home value or start your search.